Measuring What Matters: Using LLMs to Understand Your Change Failure Rate
How we built a system to classify 3,500 pull requests, trace bugs to their root causes, and discovered that our configuration problems were far more pervasive than we thought.
The DORA metrics have become something of a standard in our industry for measuring engineering team performance. Among them, Change Failure Rate (the percentage of deployments that result in degraded service) is perhaps the most humbling. It's one thing to ship fast; it's another to ship well.
When I set out to understand our organization's change failure rate, I quickly realized that the bottleneck wasn't in the measurement itself, but in the classification. We needed to accurately identify which pull requests were bug fixes versus new features, then trace those bugs back to their root causes. With thousands of PRs across multiple repositories, manual review was impractical. This is the story of how we built a system to do it at scale, what surprised us in the data, and the critical importance of manual verification.
The Classification Problem
The naive approach to identifying bug fixes is pattern matching. Look for "fix" in the PR title, check for certain branch naming conventions, scan the labels. This works for the obvious cases. A PR titled "fix: resolve null pointer in checkout flow" is clearly a bug fix. But what about "update user authentication flow" or "improve form validation"? The semantic boundary between a bug fix and an enhancement is often blurry.
We settled on a two-phase classification strategy that I've come to think of as the economically rational approach to LLM usage:
Phase 1: Heuristic Classification Fast, free, and surprisingly effective. We built pattern matchers that examine titles, branch names, and labels. A branch named bugfix/JIRA-1234 gets high confidence. A label like type:bug is even more reliable. This phase classifies roughly 40% of PRs with confidence scores between 0.75 and 0.95.
Phase 2: AI Classification For the remaining 60%, we call Claude with the PR title, description, and changed files. The prompt explicitly defines what constitutes a bug fix (correcting incorrect behavior, fixing regressions, resolving production errors) versus what doesn't (new features, refactoring, documentation). At roughly $0.001 per classification, this phase is economical enough to run at scale while being accurate enough to trust.
The key insight here is that LLMs are expensive not just in dollars but in latency. Using them as a fallback rather than a first resort gave us the best of both worlds: speed where we could get it, accuracy where we needed it.
The Importance of Manual Verification
Here's where we learned a lesson that's applicable far beyond this project: automated classification systems require ongoing human calibration.
After running our initial analysis, we reviewed sample PRs from each category to validate accuracy. During this review, we noticed something troubling: PRs that updated dependencies to fix CVE vulnerabilities were being classified as bug fixes. Technically, you could argue they are, since the vulnerable dependency represents broken behavior from a security standpoint. But semantically, they're maintenance chores. They don't represent bugs in our code; they represent vulnerabilities in upstream code.
This distinction matters when you're trying to understand your engineering practices. A security-conscious team that stays on top of CVE patches will look like they have a higher bug rate than a team that ignores security updates. That's perverse incentive structure encoded into your metrics.
We reclassified 13 such PRs, which changed our bug fix rate from 46.4% to 46.2%. A small number, but the conceptual clarity it provided was significant. We updated our classification system to detect CVE patterns (CVE identifiers, Dependabot PRs, security advisory references) and exclude them from the bug fix category while preserving them as their own tracked metric.
The lesson: any classification system will have edge cases that violate your mental model. The only way to find them is to look at the actual data. Schedule time for manual review, and build your system to support reclassification without data loss.
Tracing Root Causes with Recursive Git Blame
Knowing that a PR is a bug fix is only half the story. Understanding why the bug existed in the first place is where prevention becomes possible.
We used Claude to analyze each bug fix PR and categorize the root cause. The categories emerged from both industry patterns and our own data: logic errors, configuration issues, testing gaps, type safety failures, validation problems, API integration issues, dependency problems, state management bugs, and a few others.
But there's a subtler problem with root cause analysis: attribution. If Alice writes a function with a subtle bug, and Bob modifies that function six months later and introduces a different bug, who "caused" the bug that Bob's fix addresses? Simple git blame will point to Bob. But what if Bob's bug was only possible because of Alice's original design decision?
To address this, we built a recursive git blame system that traces three levels deep:
Level 0: The last commit that touched the buggy lines before the fix
Level 1: The commit that created the method or feature containing those lines
Level 2: The original architectural decision that shaped the code structure
This revealed something important: roughly 20% of bugs trace deeper than the last touch. When we analyzed attribution patterns, we found 193 bugs that were correctly attributable to architectural decisions made during a major migration project. Under simple blame, these would have been attributed to engineers who merely modified the code later.
This isn't about assigning individual blame. It's about understanding systemic patterns. If a particular architectural approach consistently produces bugs downstream, that's actionable intelligence for future design reviews.
The Configuration Surprise
When the analysis completed, I expected logic errors to dominate. They did, with 26% of all bugs falling into that category. But what surprised me was the second-place finisher: configuration issues at 17%.
Configuration bugs are insidious because they're often invisible to type systems and unit tests. An environment variable that's present in development but absent in staging. A feature flag that's enabled in one region but not another. A timeout value that works fine under normal load but causes cascading failures during traffic spikes.
When we broke down the configuration category into subcategories, the pattern became clearer:
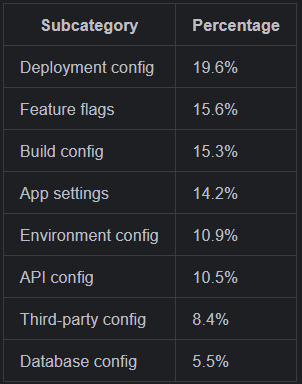
Environment configuration (the differences between local, staging, and production) accounted for more than 10% of all configuration bugs. Feature flag mismanagement was close behind.
This led to a concrete action item: we're investing in type-safe configuration loading. No more trusting that environment variables are present and correctly typed. No more implicit casting from strings to numbers or booleans. Every configuration value gets validated at startup with explicit types and sensible defaults or explicit failures.
The surprise wasn't that configuration bugs exist; every engineer knows that pain. The surprise was the magnitude. One in six bugs in our codebase traced back to configuration issues. That's not a problem you can code review your way out of. It requires systemic changes to how configuration is defined, validated, and deployed.
What the Data Tells Us About Prevention
The final analysis covered 1,624 bug fixes across six months. Here's the distribution that emerged:
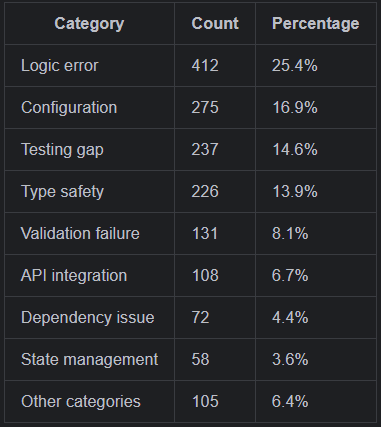
Some observations:
Testing gaps are self-documenting debt. Fifteen percent of our bugs existed because we didn't have tests that would have caught them. The fix often included the test that should have existed in the first place. This suggests that mandatory test coverage for bug fixes, specifically writing the test that would have caught it, pays compound interest.
Type safety failures persist despite TypeScript. Nearly 14% of bugs traced to type system issues: implicit any types, incorrect type assertions, generated types that didn't match runtime reality. TypeScript helps enormously, but it only helps if you use it rigorously. Strict mode, no escape hatches, and treating generated types (like GraphQL schemas) as first-class citizens of your type system.
Validation failures cluster at boundaries. The 8% of bugs in this category almost always occurred at system edges: user input, API responses, external data sources. Interior code trusted its inputs because it was "internal." But those inputs came from somewhere, and that somewhere wasn't always trustworthy.
Building This System
If you're considering a similar analysis for your organization, here's what I'd suggest:
Start with heuristics, not AI. Pattern matching on titles and labels will get you 40-50% coverage with zero cost. Use AI only for the remainder.
Plan for reclassification from day one. You will discover edge cases that violate your assumptions. Build an audit log, preserve original classifications, and make reclassification a first-class operation.
Sample and verify continuously. We reviewed 50 random PRs after each classification run. This caught the CVE issue and several other systematic misclassifications.
Go beyond surface-level blame. If you can, trace bugs to their architectural origins. The patterns that emerge are different, and often more actionable, than what simple attribution reveals.
Let the data surprise you. We went into this expecting to find testing gaps. We found configuration chaos. The value of this kind of analysis is precisely in discovering what you didn't know you didn't know.
Conclusion
The goal of measuring change failure rate isn't to produce a number that makes you look good in a quarterly review. It's to understand your engineering system well enough to improve it. That requires moving beyond simple metrics to actual root cause analysis.
LLMs have made this kind of analysis feasible at scale. But they're tools, not oracles. The human work of defining categories, validating samples, interpreting patterns, and deciding what to do about them remains irreducibly human.
Our 46% bug fix rate tells me we have significant work to do. The breakdown of root causes tells me where to focus. And the process of building this system taught me that the real value isn't in the final report. It's in the systematic attention to what's actually happening in our codebase, one pull request at a time.
This analysis covers approximately 3,500 pull requests across three repositories over a six-month period. The entire system, including the classification pipeline, recursive blame analysis, and reporting infrastructure, was built in about a week using TypeScript, PostgreSQL, and the Anthropic API. The biggest bottleneck was GitHub's API rate limits, not the complexity of the analysis itself.